Monitor global and per-domain visitor telemetry, analyze real-time HTTP status distributions, audit individual client IPs and GeoIP paths, and govern live server tasks with instantaneous 1-click process termination in MASACP.
1. Overview: The Analytics and Governor Ecosystem
The Web Traffic Analytics module inside MASACP is divided into two operational engines designed to provide full-spectrum visibility into web server throughput and Linux kernel workloads:
Traffic & Web Analytics Engine
Streams telemetry directly from high-speed Nginx access log buffers. It aggregates unique visitor IP footprints, request rates across HTTP/2 and HTTP/3 protocols, bandwidth overhead, and execution latency without database bloat.
Log-Stream Telemetry
Live Process Governor
Connects directly to Linux kernel process tables (/proc) and Cgroups v2 resource controllers. It tracks real-time CPU percentages, resident memory sets (RSS), and empowers administrators to kill rogue or runaway worker threads instantly.
Kernel Task Governor
2. Domain Scoping, Time Intervals, and Key Metrics
The top control bar allows administrators to toggle between server-wide traffic aggregations and granular, domain-specific metrics. Using the domain selector, you can switch between All Hosted Sites (Global) and any individual tenant domain.
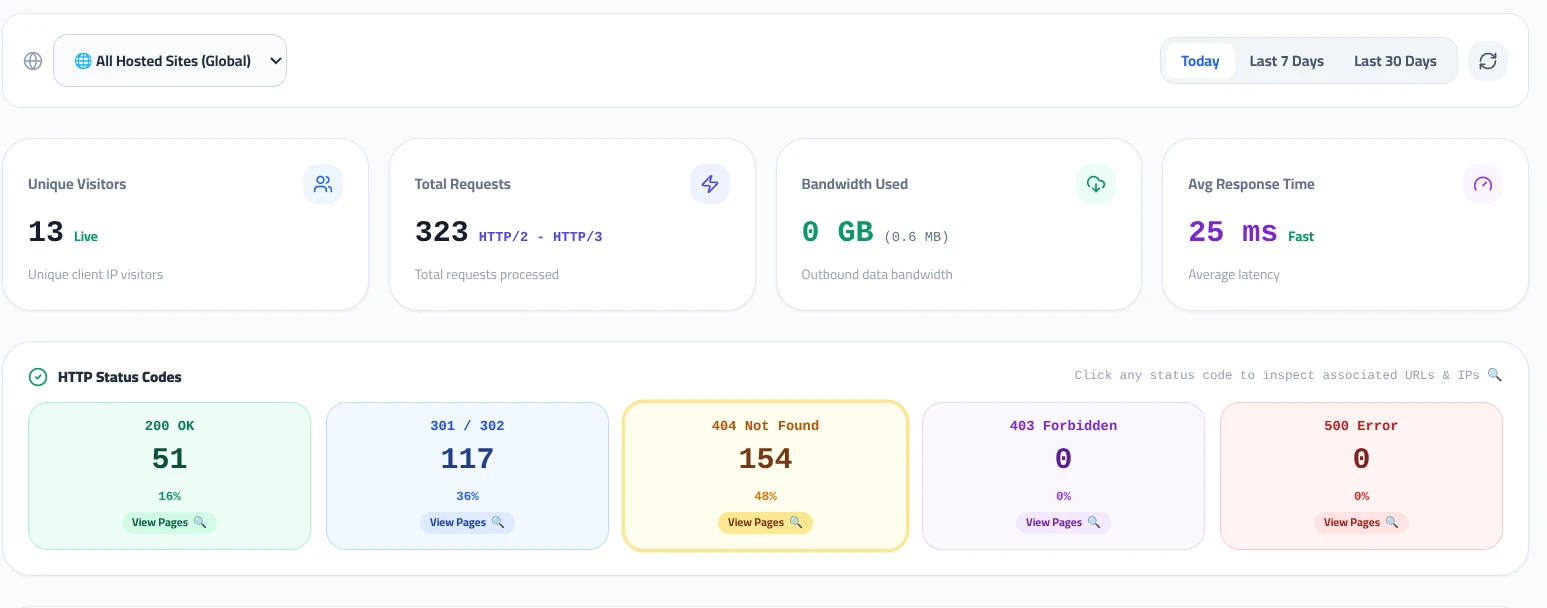
Time Period Filtering
Telemetry can be windowed across three standardized evaluation windows:
- Today: Focuses on current day traffic spikes, live crawler hits, and active sessions.
- Last 7 Days: Reveals mid-term traffic trends, weekly usage rhythms, and recurring bot sweeps.
- Last 30 Days: Highlights monthly bandwidth consumption, cumulative traffic shifts, and capacity requirements.
Core Telemetry Metric Cards
Live Count
Deduplicated client IP addresses actively initiating HTTP sessions.
HTTP/2 – HTTP/3
Total count of successful and unhandled HTTP requests processed by Nginx.
GB / MB
Outbound payload data transmitted across the wire to clients.
Latency (ms)
Average upstream processing time (Fast < 100ms, Moderate < 300ms, Slow > 300ms).
3. HTTP Status Codes and Deep Status Drilldown
The HTTP Status Codes strip breaks down server response codes into five functional health tiers:
Successful Deliveries
Canonical Redirects
Missing Endpoints
WAF / ACL Blocks
Backend Failures
Clicking on any status code card opens the interactive Page & Request Log modal for that specific status code. This modal reveals the exact routes that triggered the response, along with remote client IPs and timestamps.
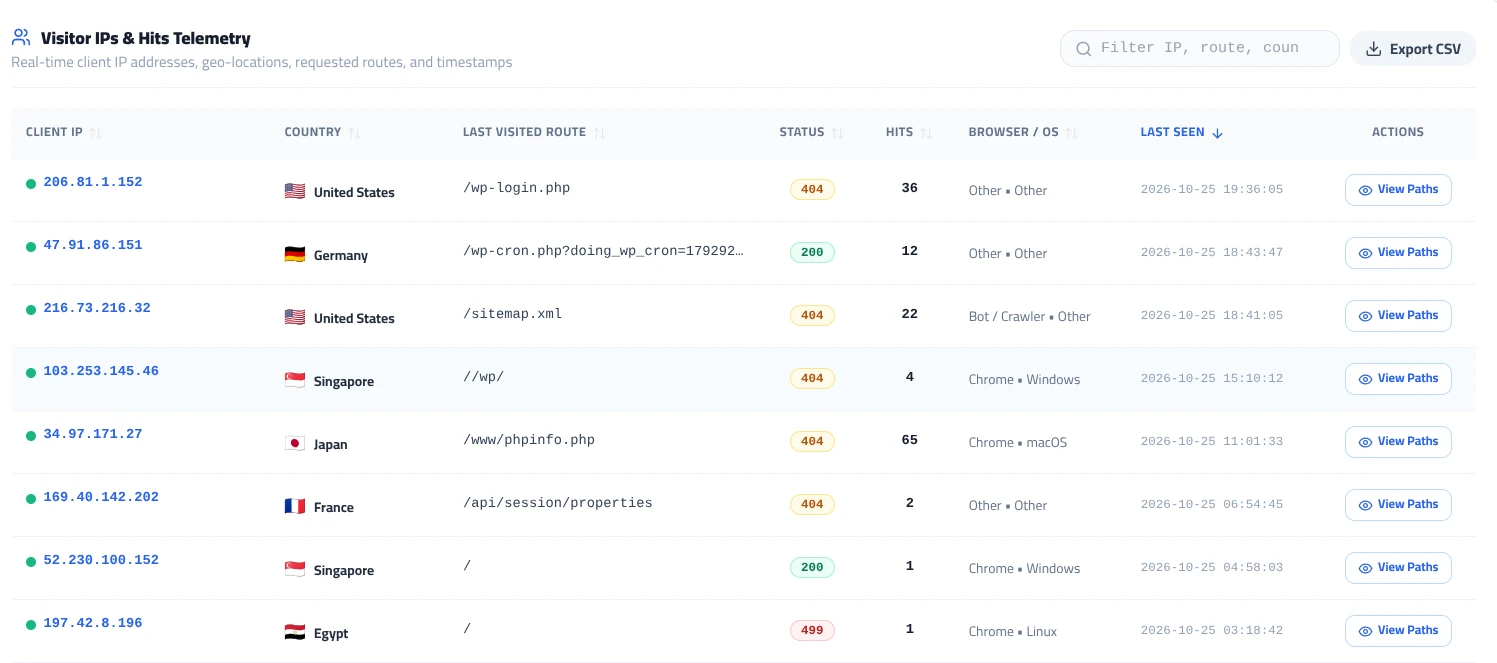
Forensic Filtering: The drilldown modal features top-affected page chips (e.g., /wp-login.php, /wp-cron.php). Clicking any chip instantly filters the telemetry table to display only hits matching that URI pattern.
4. Visitor IPs & Hits Telemetry Log
The Visitor IPs & Hits Telemetry ledger provides an exhaustive view of real-time client traffic. It decodes the raw Nginx connection stream into organized visitor records with GeoIP resolution, user-agent parsing, and route auditing.
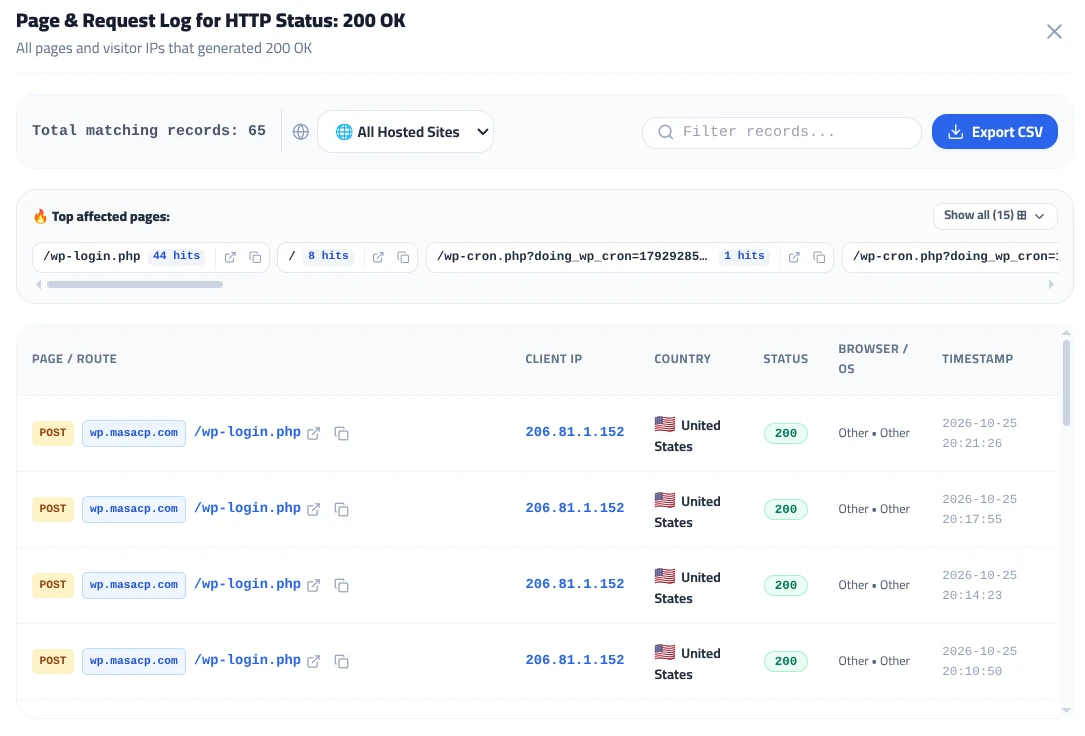
Table Data Columns
- Client IP: The verified remote IP address connecting to your web service.
- Country: The physical geo-location resolved through local GeoIP database lookups with national flag badges.
- Last Visited Route: The most recent URI path requested by this IP (e.g.,
/wp-login.php,/sitemap.xml). - Status: The HTTP response code returned to the client for their most recent request.
- Hits: Cumulative request count originated from this specific remote address during the selected time period.
- Browser / OS: Parsed client signature identifying human desktop browsers, mobile operating systems, or automated scanners.
- Last Seen: Exact server timestamp of the latest recorded connection.
- Actions: Click View Paths to open a focused activity log detailing every route accessed by this specific IP.
Administrators can utilize the search bar to filter entries by IP substring, URI route, or country name, and click Export CSV to save raw audit logs locally for compliance or offline analysis.
5. Geographic Traffic Distribution (Top Countries)
The Top Countries (GeoIP) card highlights global traffic originations, displaying absolute visitor counts, national percentage shares, and graphical distribution bars.
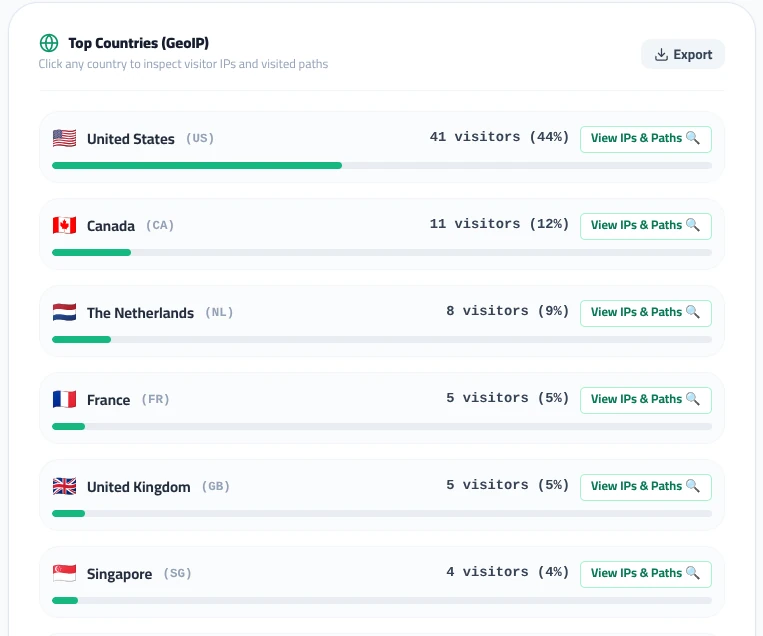
Clicking View IPs & Paths on any country record opens the Visitor Telemetry for Country modal. This view exposes exactly what visitors from that nation are accessing, their remote IPs, and the resulting HTTP status codes.
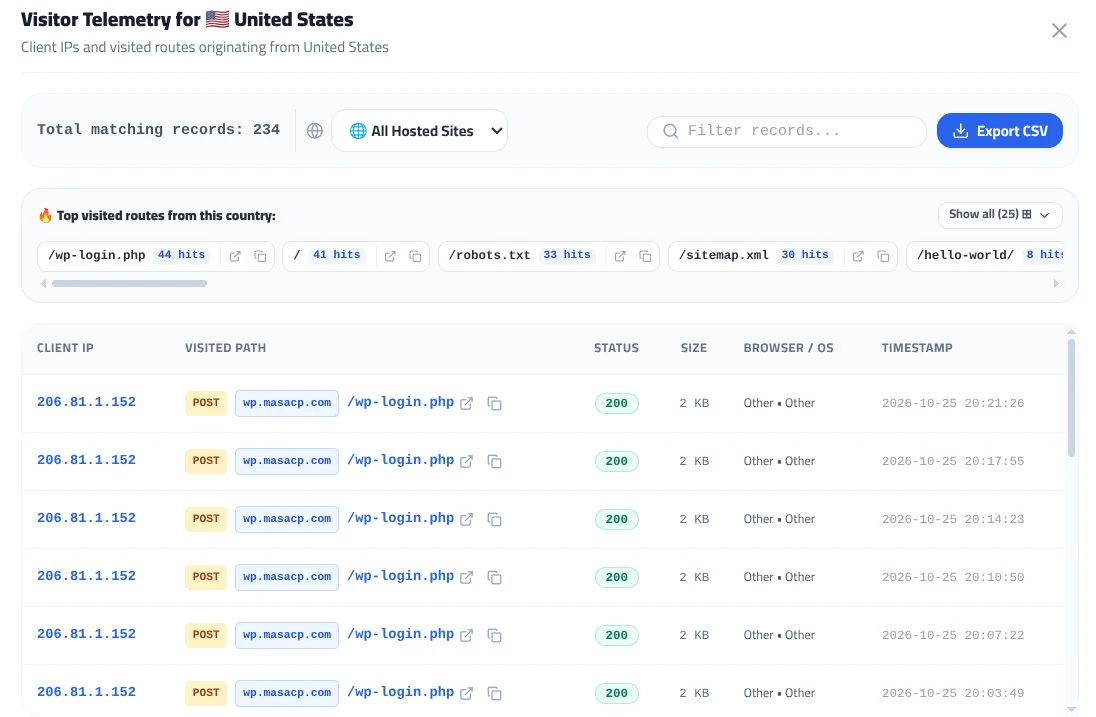
Country Drilldown Capabilities
The modal displays top visited route chips (such as /robots.txt, /sitemap.xml, /hello-world/) and provides a granular record of HTTP methods (GET, POST), response byte sizes, and user-agent classifications originating from that geographic territory.
6. Top Requested URLs and Route Forensics
The Top Requested URLs panel ranks application endpoints by hit density and bandwidth consumption. This enables administrators to identify popular public assets, cache misses, and vulnerability scanning campaigns targeting administrative backends.
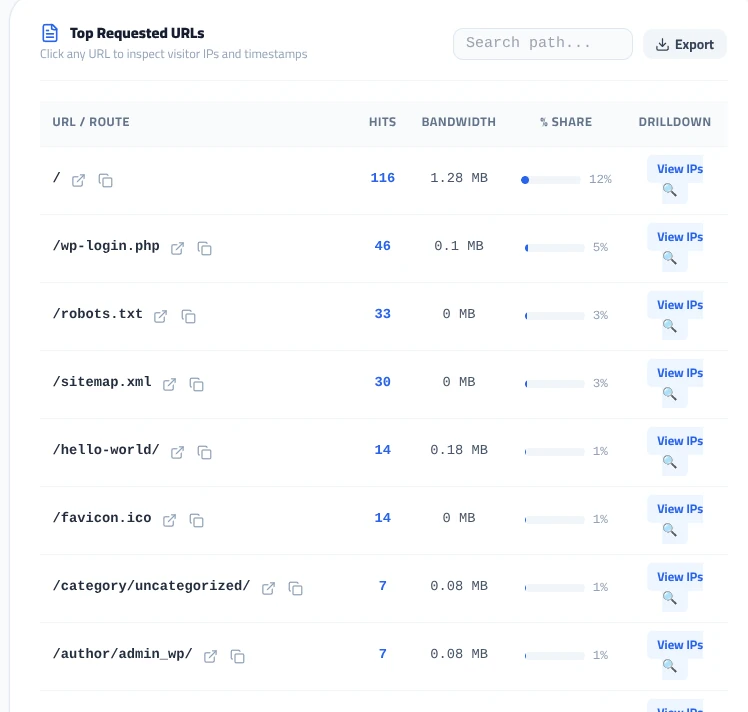
Clicking View IPs next to any URL row triggers the Traffic & Visitor IPs for Path inspection modal. This answers the critical security question: Which exact IP addresses accessed this route, and what responses did they receive?
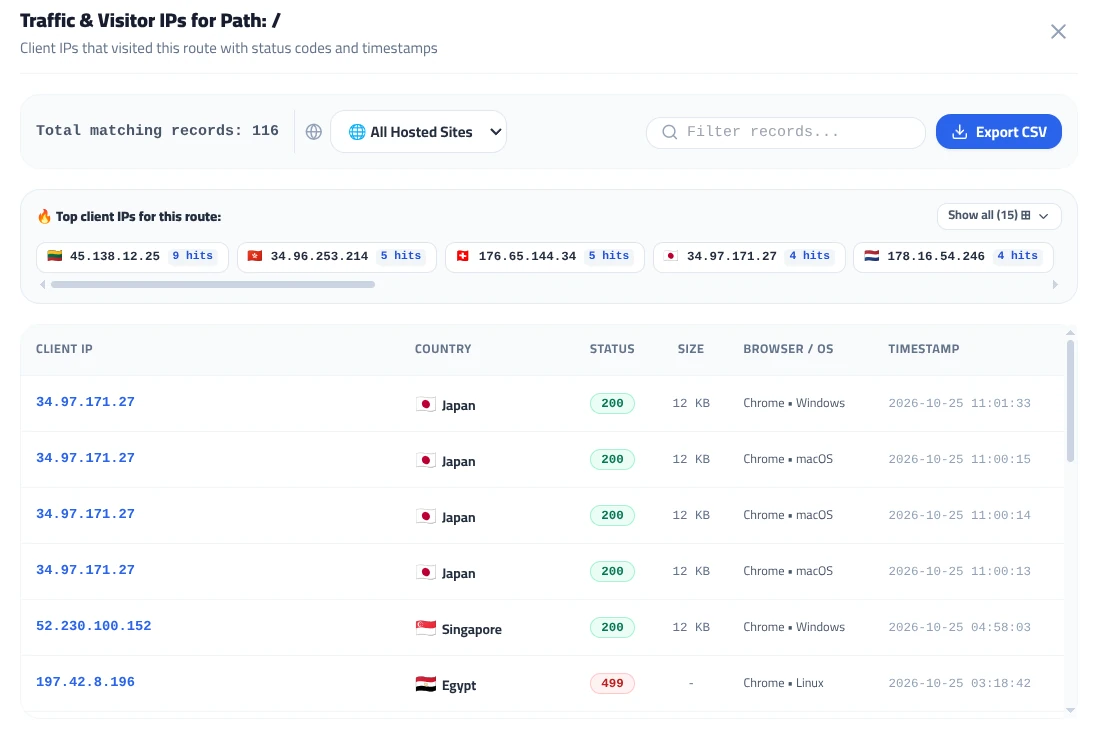
7. Client Fingerprinting and Traffic Acquisition Sources
To maintain effective caching policies and bot defense rules, MASACP analyzes client user-agent strings and HTTP referrers across all incoming requests.
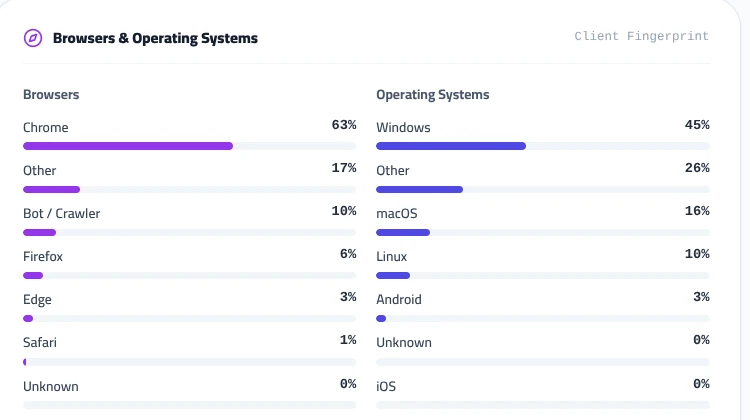
Figure 8: Browsers & Operating Systems client fingerprint breakdown.
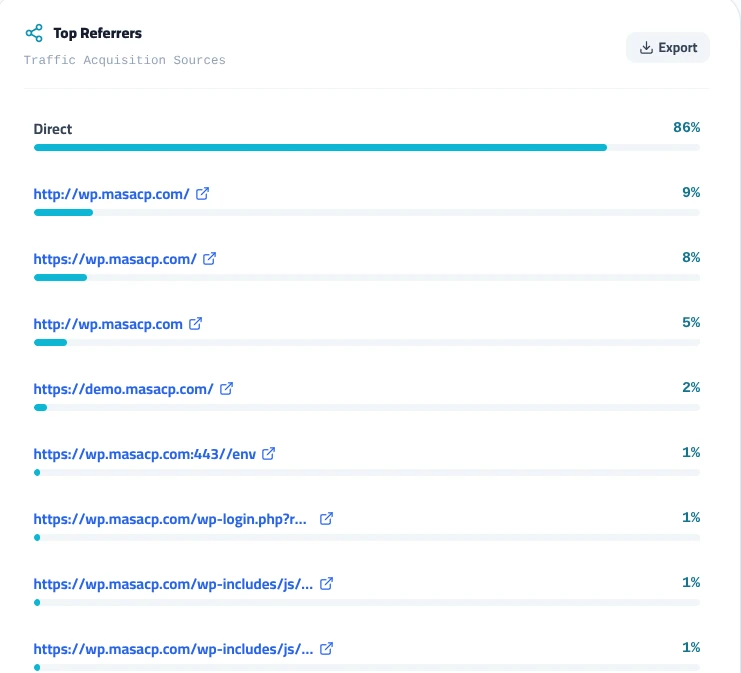
Figure 9: Top Referrers traffic acquisition sources and export interface.
Client Fingerprint Breakdown
- Browsers: Categorizes incoming traffic into Google Chrome, Mozilla Firefox, Microsoft Edge, Apple Safari, and automated Bot / Crawler requests.
- Operating Systems: Identifies underlying platforms, including Windows, macOS, Linux, Android, and iOS.
- Top Referrers: Distinguishes direct URL navigation (bookmarks, direct entry) from internal cross-links and external referring domains. Direct external links can be opened or verified with a single click.
8. Live Process Governor & Real-Time Task Termination
When traffic anomalies or poorly optimized scripts saturate server resources, administrators can switch to the Live Process Governor tab. This view provides an unbuffered window into active system processes and Linux tasks.
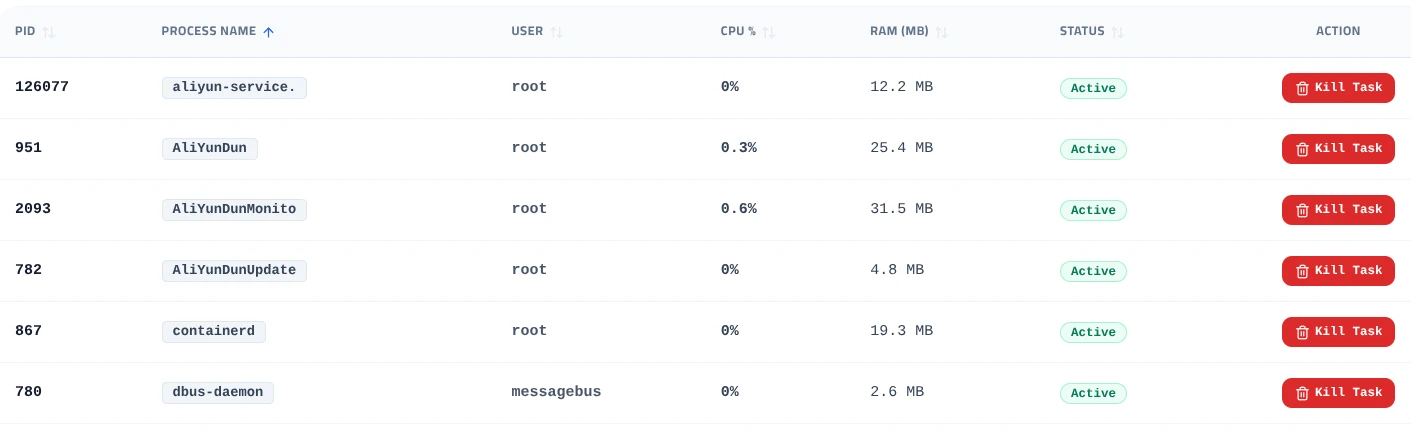
Live Process Telemetry Columns
| Column Name | Telemetry Source | Description & Operational Value |
|---|---|---|
| PID | Linux Kernel Process ID | Unique process identifier assigned by the operating system kernel. |
| PROCESS NAME | Executable binary / script | The executing binary name (e.g., php-fpm, nginx, mysqld, or background agent daemons). |
| USER | System UID / Username | Identifies whether the task belongs to the root administrator, system daemons, or isolated website tenant users. |
| CPU % | Cgroups CPU Accounting | Real-time compute capacity consumed across available processor cores. |
| RAM (MB) | Resident Set Size (RSS) | Actual physical RAM held by the process, excluding swapped memory. |
| STATUS | Task Lifecycle State | Displays Active for working threads or state flags for suspended processes. |
| ACTION | Kernel Signal Dispatch | Clicking Kill Task dispatches an immediate termination signal (SIGTERM followed by SIGKILL) to liberate server resources instantly. |
Instant Resource Recovery: When an unoptimized database query or infinite PHP loop exhausts server memory, clicking Kill Task drops the offending worker thread immediately without restarting entire web services or disrupting neighboring tenant sites.
9. Administrator Best Practices
- Isolate High 404 Status Spikes: If 404 Not Found rates exceed 30%, inspect the 404 status drilldown modal to check for automated scanning probes looking for administrative endpoints (such as
/wp-login.phpor.envfiles). - Investigate High-Latency Endpoints: When Average Response Time exceeds 300 ms, review the Top Requested URLs table and sort by bandwidth to identify uncompressed media assets or intensive dynamic PHP scripts.
- Export CSV Reports for Auditing: Use the Export CSV buttons in the Visitor IPs and Referrers tables to archive monthly compliance documentation and forensic security audits.
- Combine Telemetry with WAF Rules: If a specific remote IP generates hundreds of aggressive requests in the Visitor IPs table, cross-reference the IP with the Security WAF module to apply an automated kernel-level block.