A comprehensive guide to monitoring live application traffic, investigating intercepted security threats, analyzing incident forensics, and managing one-click IP mitigation in MASACP.
Visibility and Observability in Modern Web Security
Deploying defensive rules and web application firewalls is only half of an effective defense strategy. Without comprehensive visibility into what threats are probing your web applications, security administrators cannot identify evolving attack patterns, distinguish between botnets and targeted intrusion attempts, or address false-positive blocks affecting legitimate users.
MASACP includes a centralized Real-Time Attack Radar & Forensic Audit Log. This telemetry console aggregates live data streams from the Coraza WAF engine, Layer-7 rate limiters, anti-bot verifiers, scanner traps, and malware scanning services into a single, structured operational dashboard.
Accessing the Attack Radar & Telemetry Dashboard
To open the security telemetry console:
- Navigate to the Websites view in MASACP.
- Locate your domain and click the Coraza Enterprise WAF button.
- In the top navigation tabs, select Attack Radar & Logs.
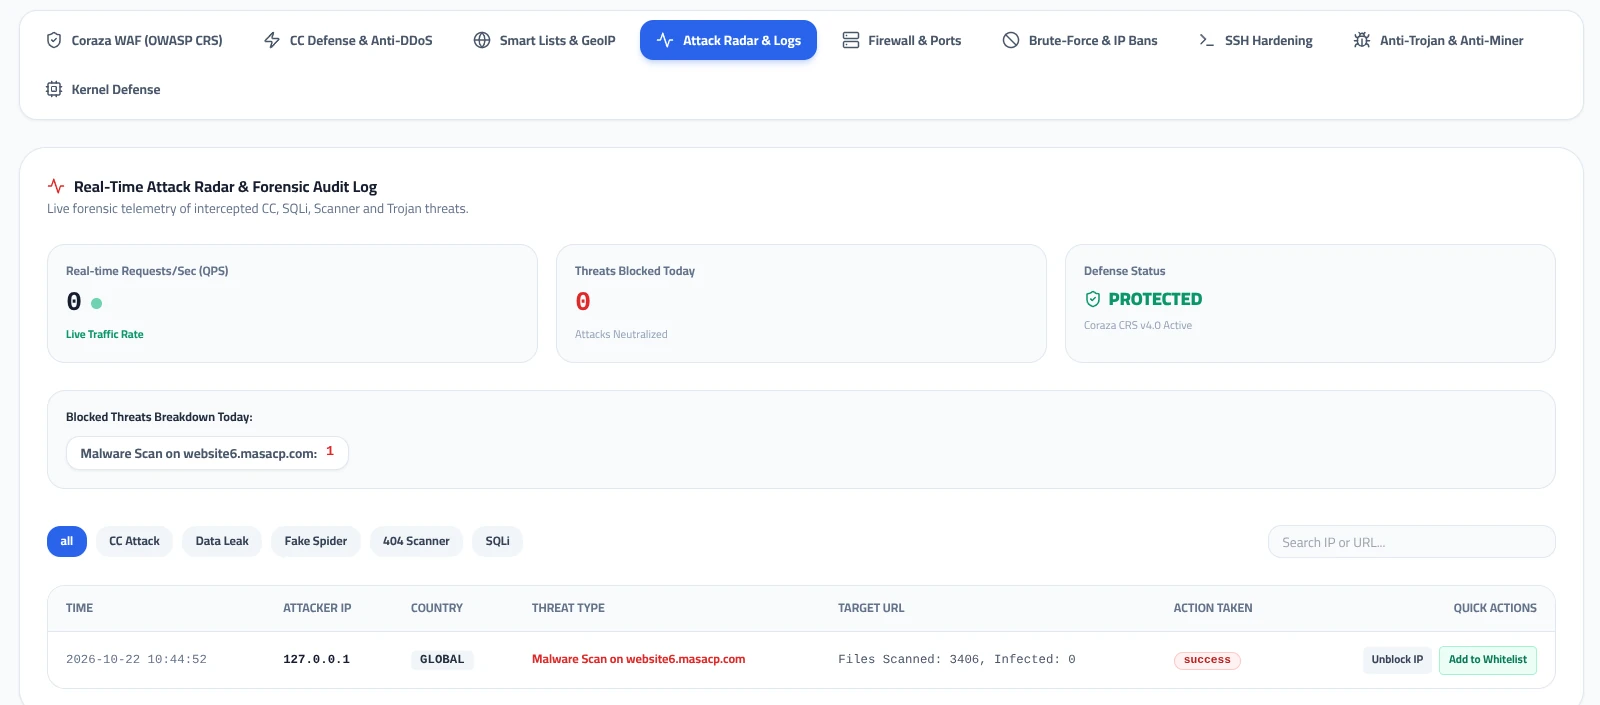
Live Metric Telemetry Cards
At the top of the interface, three real-time telemetry cards provide an immediate status report of your web server’s defensive posture:
Measures instantaneous incoming HTTP/HTTPS throughput across all active connections. A live indicator reflects current request velocity to help detect unexpected volumetric traffic spikes.
Maintains an aggregated rolling 24-hour counter of hostile connection attempts, automated scans, brute-force exploits, and malicious payloads dropped before reaching the application backend.
Verifies the operational status of the underlying security engines, confirming that Coraza OWASP CRS v4.0 rules and Layer-7 filters are actively processing edge traffic.
Daily Threat Breakdown & Incident Classification
Below the telemetry cards, the Blocked Threats Breakdown Today panel displays a categorical summary of neutralized events. Each badge represents an intercepted threat vector, showing the target virtual host and total blocked occurrences.
MASACP categorizes attack vectors into standard incident classifications:
| Incident Class | Engine Source | Trigger Condition & Security Impact |
|---|---|---|
| CC Attack | Layer-7 Rate Limiter | Client IP exceeded maximum QPS or burst thresholds, attempting to exhaust backend PHP worker threads. |
| Data Leak | Sensitive File Shield | Automated requests attempting to fetch protected configuration archives, dotfiles, or database dumps (e.g., .env, .git). |
| Fake Spider | DNS PTR Validator | Inbound web scrapers mimicking Googlebot or Bingbot User-Agents that failed Reverse DNS cryptographic domain validation. |
| 404 Scanner | Path Traversal Trap | Brute-force directory discovery tools (WPScan, Gobuster) generating excessive 404 errors within a brief temporal window. |
| SQLi | OWASP CRS Ruleset | Inbound query parameters, headers, or POST bodies containing SQL injection grammar, UNION statements, or stacked queries. |
| Malware Scan | File Integrity Engine | Scheduled or on-demand file scans auditing document roots for webshell signatures, trojan obfuscation, or backdoor scripts. |
Filtering and Searching the Forensic Audit Log
High-traffic web servers may process millions of requests daily. To pinpoint specific incidents rapidly, the forensic table provides responsive category filter pills and an instant search bar:
- Filter Pills: Click any badge (
all,CC Attack,Data Leak,Fake Spider,404 Scanner, orSQLi) to immediately isolate the log feed to that specific attack taxonomy. - Universal Search Bar: Type an IPv4/IPv6 address, a domain name, or a URI fragment (such as
/wp-login.php) into the Search IP or URL… field to filter matching events in real time.
Audit Log Table Attributes
Each log entry provides structured forensic data points:
- TIME: Precise server timestamp when the security violation occurred.
- ATTACKER IP: The origin IP address captured during the connection handshake.
- COUNTRY: Geographic country tag resolved via the local MaxMind GeoIP2 database.
- THREAT TYPE: The specific security rule, scanner pattern, or CRS signature that matched the payload.
- TARGET URL / DETAILS: The targeted URI path or detailed execution metrics (such as the number of scanned files).
- ACTION TAKEN: The defensive response applied by the engine (e.g.,
blocked,banned, orsuccess). - QUICK ACTIONS: Instant administrative remediation buttons.
Rapid Incident Response & False-Positive Handling
When reviewing blocked events, administrators often need to take immediate corrective action without navigating through multiple setting pages. The QUICK ACTIONS column provides two integrated response options on every row:
Unblock IP
If a legitimate user or internal testing workstation triggered a rate limit or 404 scan trap by accident, clicking Unblock IP immediately removes the IP from the temporary in-memory ban zone. The client can resume browsing without waiting for the ban duration to expire.
Add to Whitelist
Clicking Add to Whitelist permanently registers the selected IP into the website’s persistent IP Whitelist configuration. All future requests from this source address bypass both Coraza WAF inspection and CC rate limiters entirely.
Recommended Security Operations (SecOps) Routine
1. Daily Audit Routine: Review the Threats Blocked Today breakdown once daily. An unexpected surge in 404 Scanner or Data Leak attempts often precedes a coordinated exploitation campaign.
2. Validating Developer Activity: When software development teams report intermittent HTTP 403 or 429 errors during API integration or automated staging tests, filter the audit log by their office IP to pinpoint whether a specific OWASP CRS rule or rate limit threshold was triggered.
3. Proactive Subnet Blacklisting: If you observe dozens of distinct IP addresses from the same /24 CIDR block generating SQL injection attempts, navigate to the Smart Lists & GeoIP tab and add the entire subnet to the permanent IP Blacklist.